Forex Strategy – Elliott Wave Theory – Fibonacci

Arichive : Forex Strategy – Elliott Wave Theory – Fibonacci
Leonardo da Pisa developed the Fibonacci sequence in the thirteen century. The series starts like this: 1-1-2-3-5-8, and so on. Elliott, in his work “Nature’s Law,” said Fibonacci provides the mathematical basis of the Wave Principle. In this educational article, we will review how to apply the Fibonacci sequence to the Elliott Wave Theory.
The Fibonacci ratios
The Fibonacci sequence has its origin in Leonardo da Pisa’s work, “Liber Abacci.” In his work, the mathematician responses to the question:
How many pairs of rabbits placed in an enclosed area can be produced in a single year from one pair of rabbits if each pair gives birth to a new pair each month starting with the second month?
The answer to this question resulted in the series calculated as follows: The first month, there will be zero plus one that results in one pair. The next month, the rabbits will reproduce, expanding to two pairs. In short, the sequence of rabbits is as follows, 0, 1, 1, 2, 3, 5. The series concludes that at the end of the year, there will be 144 pairs of rabbits.
From the Fibonacci series, we obtain the main ratios of this sequence; these are 0.618 and 1.618; this number is known as the Golden Ratio.
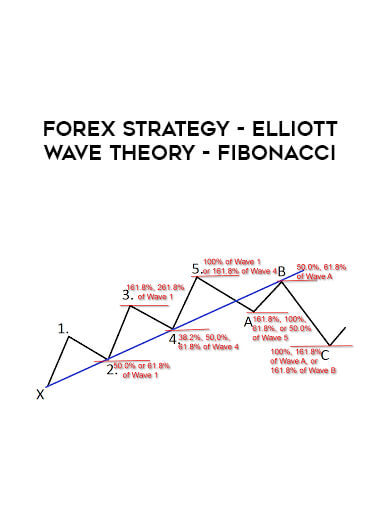
In the Elliott Wave Analysis, we use some specific level to evaluate the retrace and potential next movement of the market; these levels are as follows:
Retracement:
- 0.09
- 0.146
- 0.236
- 0.382
- 0.5
- 0.618
- 0.764, some authors prefer to use the 0.786 level.
- 0.854, some authors prefer to use the 0.886 level.
Expansion:
- 0.618
- 1
- 1.272
- 1.414
- 1.618
- 2
- 2.272
- 2.618
Use of Fibonacci tools in the financial markets
Until now, we used neither a mathematical method to determine price targets. Consider that the price action is not compelled to respect a Fibonacci level by itself. These tools provide a probability zone to a reaction.
The following chart corresponds to AT&T (NYSE:T) in its daily timeframe. The bullish cycle started on August 24, 2019, when T found buyers at $30.97 per share.
The first Elliott wave movement calls for a leading diagonal structure, which made the wave 1 of Intermediate degree. Using the Fibonacci retracement tool, we observe that wave (2) retraces near to 38.2% o wave (1).
The wave (3) accomplishes the rule that commands “wave 3 is the largest wave.” In wave (4), we observe that respect the alternation rule that says, “if wave two is simple, wave four will be complex, and vice-versa.” This wave retraces between 23.6% and 38.2% of wave (3).
Finally, from wave (5), the price action drove to strike over the upper-line of the ascending channel.


Reviews
There are no reviews yet.