


Master Data Visualization With Python
 Salepage : Master Data Visualization With Python
Arichive : Master Data Visualization With Python
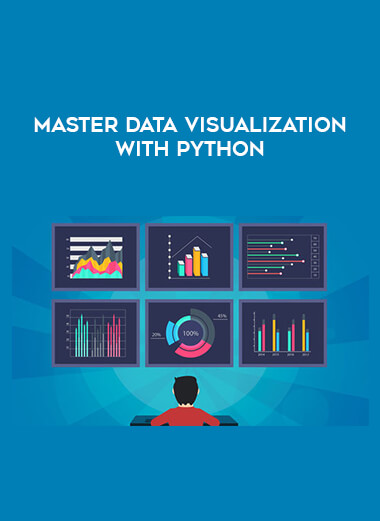
Python is an especially valuable tool for visualizing data, and this course will cover a variety of techniques that will allow you to visualize data using the Python library, Matplotlib. Beginning with an intro to statistics, you’ll extend into a variety of plots that will cover most use-cases.
Access 20 lectures & 3 hours of content 24/7
Explore bar charts, line plots, & scatter plots
Learn about advanced plots such as Quiver plots, 3D lines, & 3D surfaces
Discover subplots & how they’re used
Software developer and founder of ZENVA. Since 2012, Pablo Farias Navarro has been teaching online how to create games, apps and websites to over 150,000 students through the Udemy and Zenva Academy platforms, and created content for companies such as Amazon and Intel.
Pablo is a member of the Intel Innovator Program in the Asia Pacific, and has run live programming workshops in San Francisco, Brisbane and Bangalore. Pablo holds a Master in Information Technology (Management) degree from the University of Queensland (Australia) and a Master of Science in Engineering degree from the Catholic University of Chile.
Details & Requirements
Length of time users can access this course: lifetime
Access options: web streaming, mobile streaming
Certification of completion not included
Redemption deadline: redeem your code within 30 days of purchase
Experience level required: all levels


Reviews
There are no reviews yet.