


Vladimir Ribakov – The Classic Boundary Breakout Strategy
 Salepage : Vladimir Ribakov – The Classic Boundary Breakout Strategy
Arichive : Vladimir Ribakov – The Classic Boundary Breakout Strategy
Description
In this lesson I’d like to present to you one of the simplest and most profitable strategies.
I’ve first encountered this strategy 2 years ago, and frankly it was during a vacation…
We’ve met a genius who traded Forex and stocks for 10 years. This guy’s motto was: „what isn’t simple, isn’t”. He insisted that trading has to be the simplest possible. If you turn your chart, which represents simple price action, into something that looks like a Picasso painting, you will turn your account into a zero…
One must admit it’s a very interesting and refreshing theory. And even more interesting, after meeting this guy, my trading improved.
Now, let’s examine this system:
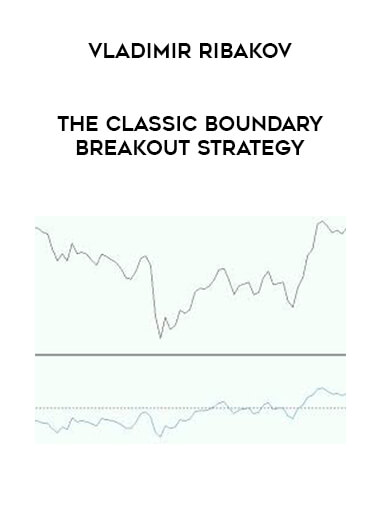
First of all, forget all chart types you’ve known up until now. According to this strategy, the only chart you need is a line chart.
This chart:
Without any Japanese candlesticks and other ornaments. Just a line chart.
Note that this chart only shows closing rates of each bar.
You can display this type of chart using this toolbar button on the top of your MetaTrader screen:
The only indicator you’ll need is the RSI.
Why?
Because RSI best reflects the relative market force during breakouts of trade boundaries.
This is how your complete chart should look like:
Now let’s go over some simple concepts you need to understand:
Support level, Resistance level, RSI 50 level and a Trend Line.
Resistance level: this is a price level above current market price. It is determined (put in place) when the buyer’s power runs out and a top is seen. As soon as the market returns to this top, or in its correct name, Resistance level, there will be a „war” between buyers and sellers. If the sellers win, the market will stop around this level again.
The more visits the market pays in this level, the more it’s considered strong and valid.
This is an example of a Resistance level:
See how the market touches the same spot over and over again.
Support level: similar to a Resistance level only it is below the market price. It is determined (put in place) when the seller’s power runs out and a bottom is seen. As soon as the market goes down again to this bottom, or in its correct name, Support level, there will be a „war” between buyers and sellers. If the buyers win, the market will stop around this level again.
The more visits the market pays in this level, the more it’s considered strong and valid.
This is an example of a Support level:
It’s important you remember that once a Resistance level is broken and the market continues above it, which is what happens when the buyer’s power increases – that Resistance level turns into a support level.
Trend Line: a rising trend line is a line that connects several bottoms, each bottom is higher than the previous bottom, and each top is higher than previous top.
Here’s an example of a rising trend line:
A falling trend line is a line that connects several tops, each top is lower than the previous top, and each bottom is lower than the previous bottom.
Here’s an example of a falling trend line:
The last concept I’d like to introduce is the test level of the Relative Strength Indicator (RSI).
RSI’s test level is 50. When the indicator breaks the 50 level from below to above, it might signal us we’re facing an up move in the market. When the indicator breaks the 50 level from above to below, it might signal us we’re facing a down move in the market.
Another important thing I need you to realize is that RSI has both support and resistance lines.
Here are examples taken from the RSI indicator:
Now, after you understand all the basic concepts, let’s see when to enter and exit trades.
There are several possibilities:
Support level on the chart is broken down, and there’s a break down of the 50 level.
See how this move looks in our usual charts:
We have a very respectable 60 pips move here. And it’s on a 15 minutes chart!
Same principle works for an up move:
Resistance level on the chart is broken up, and there’s a break up of the 50 level.
I’d like to stress a point here: it’s possible you will see a break of the support or resistance, and the RSI will break even before that. This is still acceptable.
It also goes the other way around: if a support or resistance is broken and RSI broke after several bars, it’s still ok, as long as price remains above the resistance (in case of a break up).
Here are a couple of examples:
Above you can clearly see that the RSI was the first to break, and only then did the support level broken.
Once it was broken, RSI was below 50 so it’s a valid setup.
Above you can see that the RSI broke just before the resistance level was broken.
Once it was broken, RSI was above 50 so I’m good with it. The most dependable entry signal is to my opinion related to trend lines.
If a trend line is broken, whether it is rising or falling trend line, and along with the break we see a break of the RSI’s own trend line.
Here are some examples to make it easy to understand:
You can see how the trend line in the market was broken, and at the same time the falling trend line in the RSI also broken. There is a high chance of a strong move here.
Here’s another example:
That’s it, my friend.
The strategy is so simple – you just need two events to happen simultaneously: a break both in the price chart and the indicator.
As far as Stop Loss and Take Profit go, this is what I do:
I place a Stop above the last high (for buy) or below the last low (for sell), and Take Profit at the next visible support or resistance.
After breakout, you should aspire for 20-50 pips profitable move.
Most recommended pairs are: EURUSD, GBPUSD, USDCAD, EURJPY. Chart timeframe: M15 or H1 (15 minutes or one hour).
It’s a good way to exploit the current market which somewhat lacks long term trends, but moves strongly in the short term.


Reviews
There are no reviews yet.